Section 6. Wider context: Ashfield area emissions
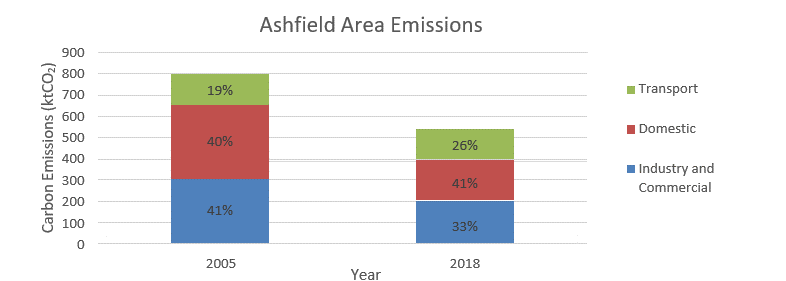
Ashfield District’s area Scope 1 and 2 emissions accounted for 536 thousand tonnes of carbon dioxide (ktCO2) in 201829, 33.2% less than in 2005. The 2018 emissions mix was 41% domestic, 33% industrial and commercial, and 26% from the transport sector. This demonstrates that the domestic share of emissions has stayed relatively the same since 2005, compared to a reduction in industrial and commercial emissions and an increase in the transport sectors share. Ashfield area’s Scope 1, 2 and 3 emissions were 770 ktCO2e in 201830.
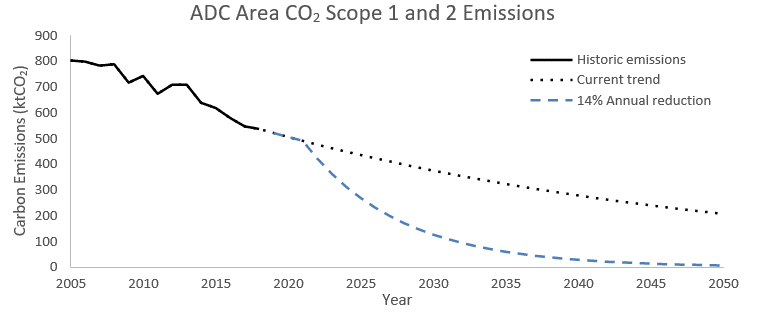
Over the last 14 year period, Scope 1 and 2 emissions have on average reduced by 2.94% per year. If this trend was to continue Ashfield area emissions would still be 375 ktCO2 in 2030 and 206 ktCO2 in 2050. This demonstrates the need for Ashfield’s area emissions to reduce at a greater rate and magnitude than the historic trend.
The Tyndall Centre suggests the Ashfield area has a carbon budget of 4 MtCO2 for Scope 1 and 2 emissions between 2020 and 2100. If Ashfield emissions continued on the historic trend, this budget would be used up during 2028. All emissions past this point would be contributing to a dangerously warmer world. In order to keep emissions below this carbon budget and achieve net zero emissions by 2050, in line with national targets, annual emissions reduction rates must be in the region of 14% per year, from 2022 to 2050.
29 These emissions account for scope 1 and 2 area emissions as identified by BEIS CO2 emissions for local authorities
30 These emissions account for scope 1, 2 and 3 area emissions as identified by SCATTER CO2e emissions for local authorities. This uses some different source data to the BEIS inventory, and is not directly comparable.