Section 2. Overview of ADC emissions
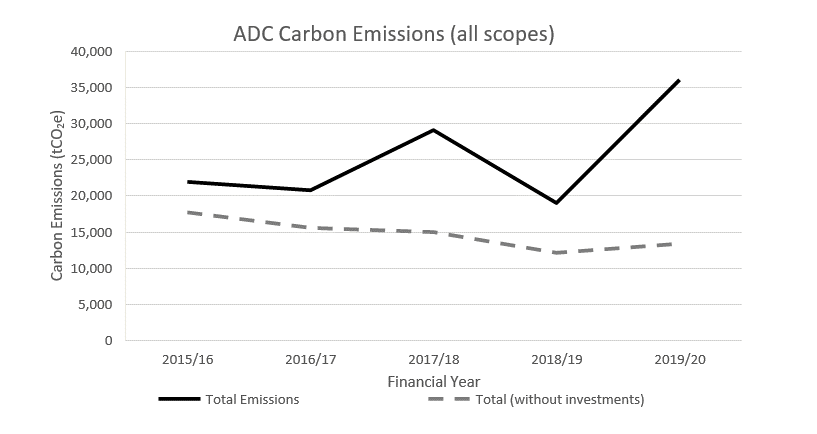
Ashfield District Council total net carbon emissions (for all scopes)8 in 2019/20 were 36,137 tCO2e, 64% more than in 2015/16.
This increase is as a result of Scope 3 investment emissions (see Scope 3 category 15 investments section). Removing investment emissions from this total demonstrates that for all other scopes and categories, ADC emissions reduced by 24% since 2015/16, with an annual average reduction of 6.1%.
Total net carbon emissions for ADC (including investments) equates to 63.3 tCO2e per ADC employee, an 87% increase since 2015/16. Not including investments, this is 23.5 tCO2e per employee, a reduction of 14% since 2015/169.
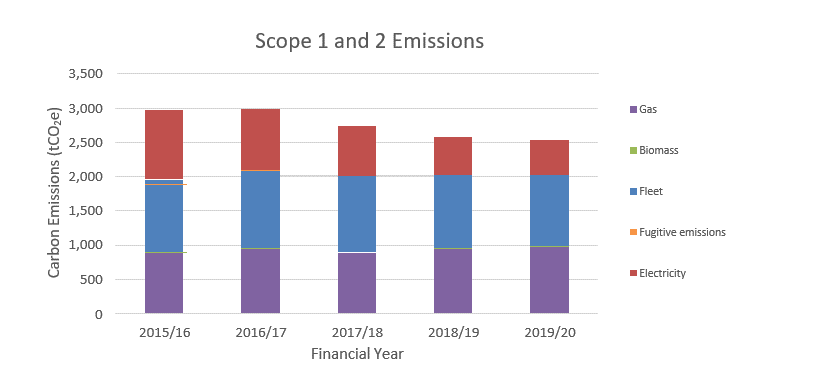
Scope 1 and 2 emissions for the Council include direct emissions from ADC controlled sources and indirect emissions from the generation of purchased energy.
Between 2015/16 and 2019/20 financial years, ADC reduced scope 1 and 2 emissions by 14.8%. These emissions are broken down further by their source in the graph below. Over this same period, gas emissions have increased by 11%, whilst fleet emissions have reduced by 4% and electricity emissions by 50%.
In 2019/20, these emissions accumulated to 2,531 tCO2e, 7.0% of ADC’s full carbon footprint (19% of ADC’s carbon footprint, not including investments). Emissions from fleet use contributed the largest proportion of these emissions (41%), followed by gas use (39%), electricity use (20%) and biomass use and fugitive emissions (<1%).
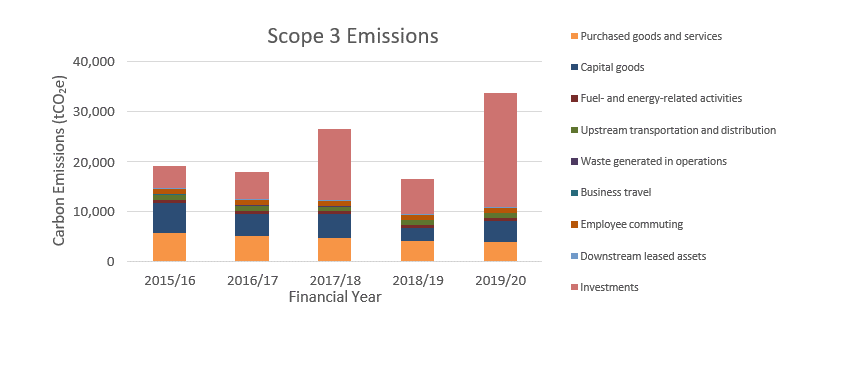
Since 2015/16, ADC Scope 3 emissions have increased by 77% to 33,607 tCO2e in 2019/20. This increase is as a result of changes to ADC scope 3 investment emissions (See Section 5: Scope 3 category 15 investments). If investment emissions were removed from this total, the remaining scope 3 emissions have reduced by 26% since 2015/16. ADC scope 3 emissions are split by source in the graph below. 2019/20 scope 3 emissions were dominated by investments (68%), followed by capital goods (12%), purchased goods and services (12%), upstream transport and distribution (3%), employee commuting (3%) and all other categories (2%)10. Of the Scope 3 emissions categories, it should be noted emissions from investments and capital goods can fluctuate to a much greater extent year-on- year due to particular investments or large scale purchases in a particular year. This affects the trend in overall emissions seen.
8 See Appendices 1 and 2 for explanation of gross emissions, net emissions and total net emissions presented in this report.
9 Over this same period the number of employees has reduced from 650 to 571 (12% reduction)
10 See each category in section 5 for changes to category emissions since 2015/16